
Datarails is the financial planning and analysis platform for Excel users. It automates data consolidation, reporting and planning, while enabling finance teams to continue using their own Excel spreadsheets and financial models.
Automating these time-consuming manual processes paves the way for finance teams to spend more time analyzing data and less time collecting it. It also empowers them to answer essential strategic questions like what their organization can do to increase revenue and reduce expenses.

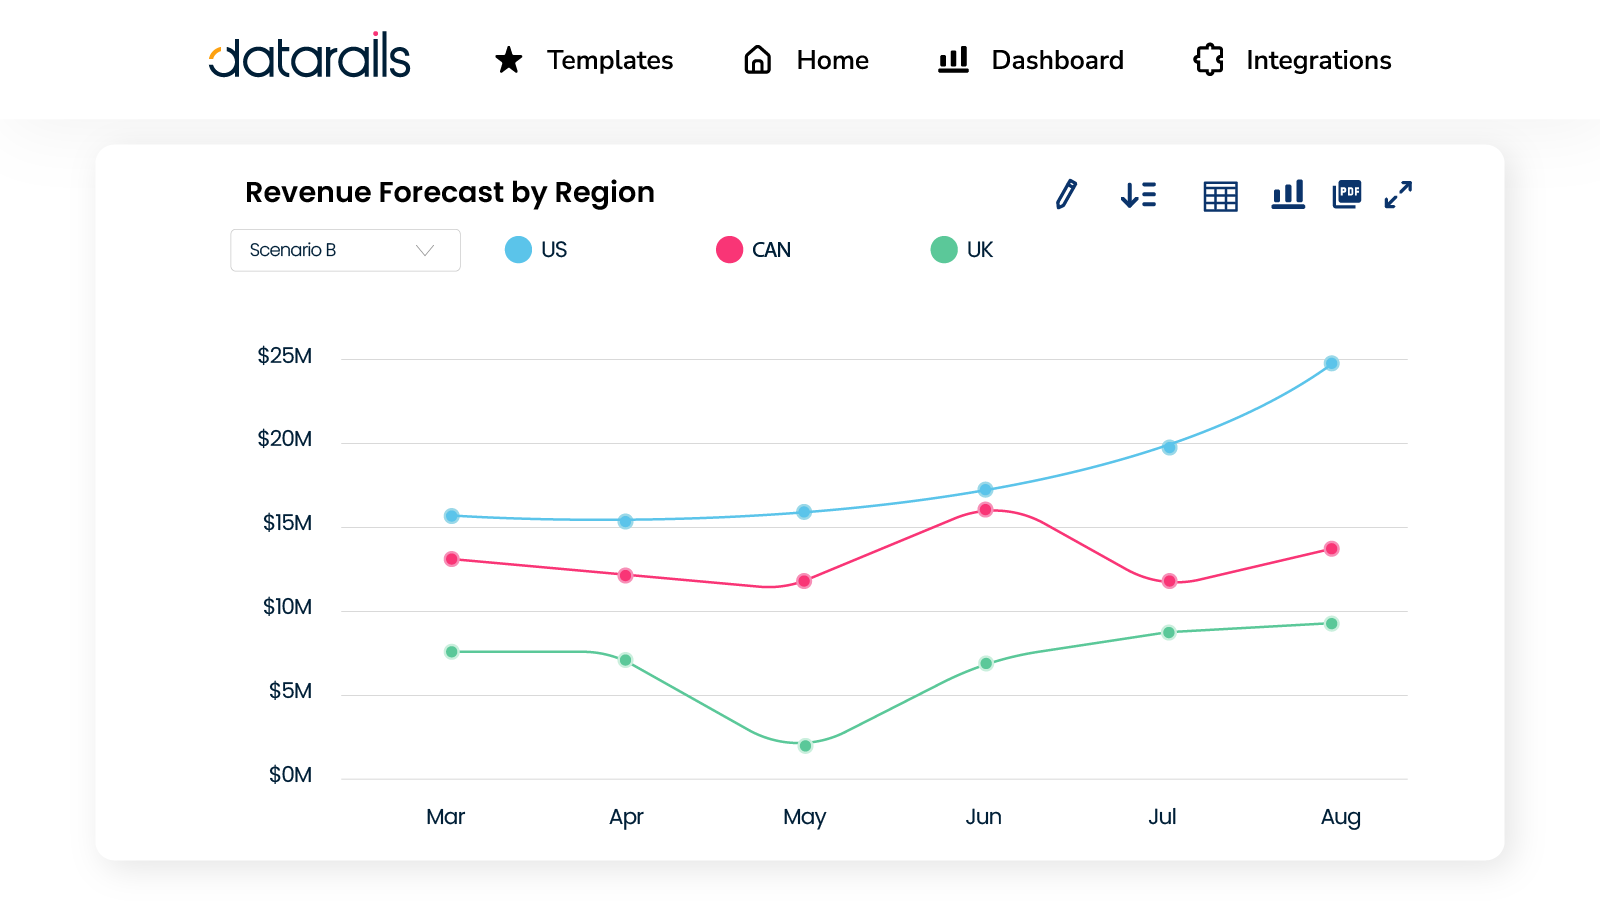
Embrace the notion that not everyone loves a spreadsheet as much as you do, and use graphs and charts to share the story of your data and collaborate with other teams
Reduce the repetitive, time-consuming and error-prone tasks needed for manual data collection. Work with one source of truth by pulling in your financial and operational data into Datarails from HubSpot and any other data source in any format.

Automate your budgeting process with Datarail. Keep your reports in the formats you've come to know and love or choose from our library of templates while utilizing the functionality of a 100% native Excel interface. Then leverage analysis tools to help you provide the actionable insights that will increase revenues and decrease costs.

Data-driven projections are crucial to preparing for the future. So is the flexibility to choose which metrics you’d like to forecast – and how often. Revenue? Costs? Cash flow? Head count? We’ve got you covered, through next week, next month, next quarter or next year.
Streamline your financial reporting process through a workflow, where you can quickly check the status of each file and share your financial statements as Excel reports, PDFs, live dashboards or real-time PowerPoint presentations.

